반응형
Chart
import streamlit as st
import pandas as pd
import matplotlib.pyplot as plt
import seaborn as sns

def main() :
    st.title('차트 그리기 1')

    df = pd.read_csv('data2/iris.csv')
    st.dataframe(df)
scatter
 fig = plt.figure()
    plt.scatter(data=df, x='sepal_length', y='sepal_width')

    plt.title('sepal length vs width')
    plt.xlabel('Sepal Length')
    plt.ylabel('Sepal Width')
    st.pyplot(fig)
scatterplot
fig2 = plt.figure()
    sns.scatterplot(data=df, x='sepal_length', y='sepal_width')

    st.pyplot(fig2)
regplot
fig3 = plt.figure()
    sns.regplot(data=df, x='sepal_length', y='sepal_width')
    st.pyplot(fig3)
histogram
 fig4 = plt.figure(figsize= (10,4))
    plt.hist(data=df, x='sepal_length', bins=20, rwidth=0.8)
    st.pyplot(fig4)
subplot
fig5 = plt.figure()
    plt.subplot(1, 2, 1)
    plt.hist(data=df, x='sepal_length', bins=10, rwidth=0.8)
    plt.subplot(1, 2, 2)
    plt.hist(data=df, x='sepal_length', bins=20, rwidth=0.8)
    st.pyplot(fig5)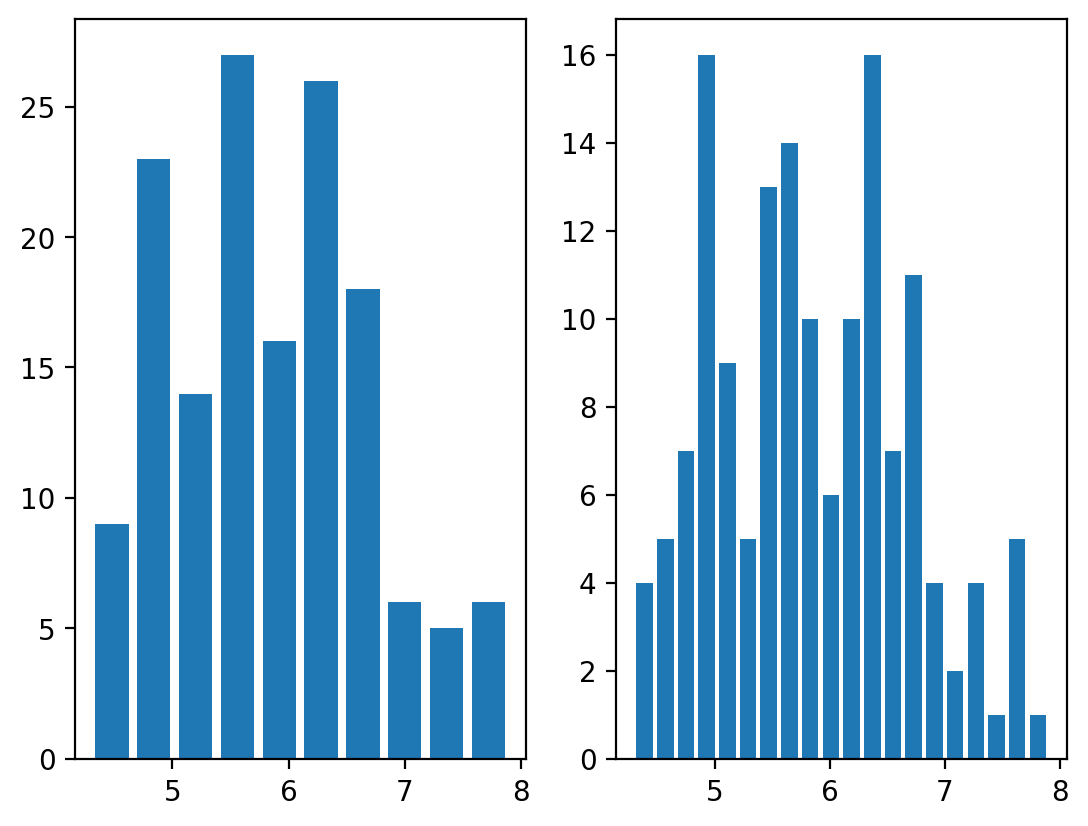
countplot
 fig6 = plt.figure()
    sns.countplot(data=df, x='species')
    st.pyplot(fig6)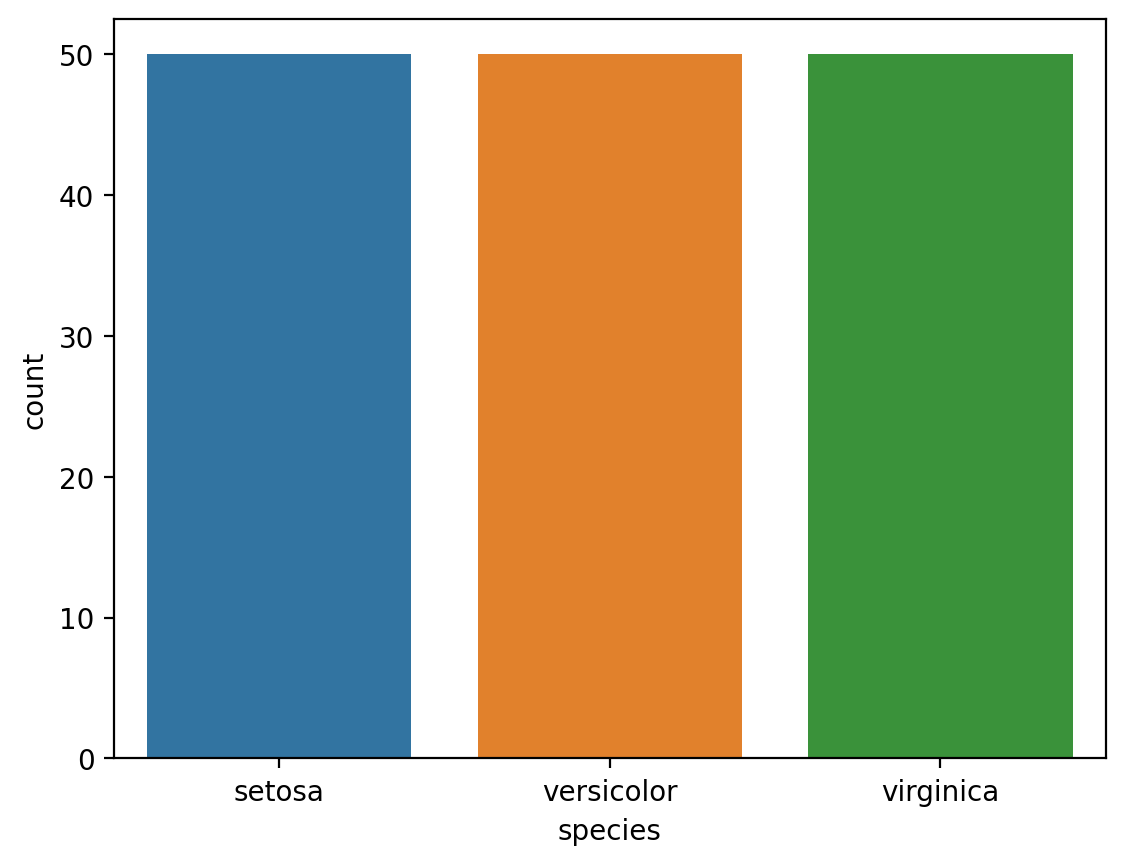
반응형
'Library > Streamlit' 카테고리의 다른 글
| Streamlit - Google Colab에서 학습한 인공지능을 사용하는 방법 (0) | 2022.05.22 |
|---|---|
| Streamlit - Streamlit에서 제공하는 Chart (0) | 2022.05.19 |
| Streamlit - Python 개발시 파일을 분리하여 개발하는 방법 (0) | 2022.05.19 |
| Streamlit - sidebar를 만들고 file_uploader() 함수 이용하기 (0) | 2022.05.19 |
| Streamlit - UI Functions (0) | 2022.05.19 |


