반응형
Streamlit에서 제공하는 Chart
import streamlit as st
import pandas as pd
import altair as alt
import plotly.express as px


 df1 = pd.read_csv('data2/lang_data.csv')
    st.dataframe(df1)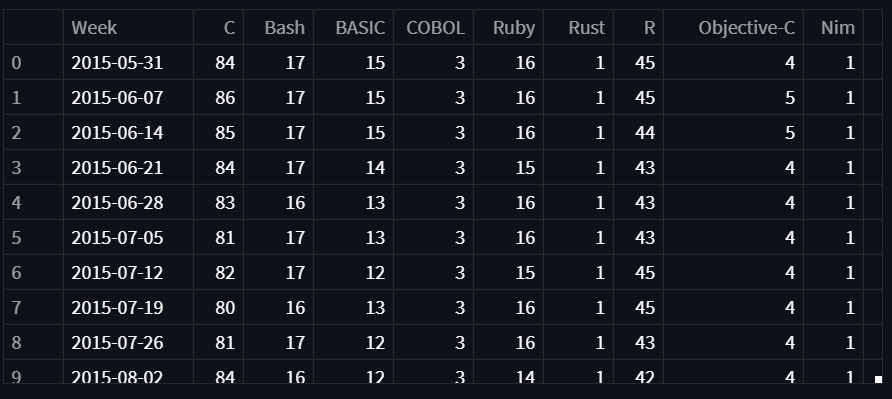
line_chart
st.line_chart(df_choice)
area_chart
st.area_chart(df_choice)
map_chart
df3 = pd.read_csv('data2/location.csv', index_col=0)
st.dataframe(df3)

st.map(df3)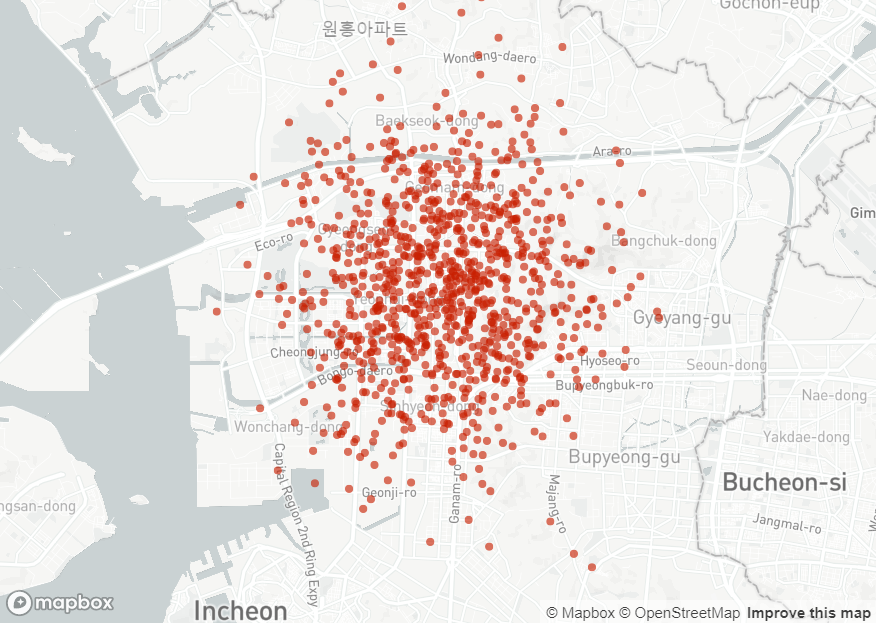
plotly pie chart
fig1 = px.pie(df4, names='lang', values='Sum', title= '각 언어별 파이차트')
st.plotly_chart(fig1)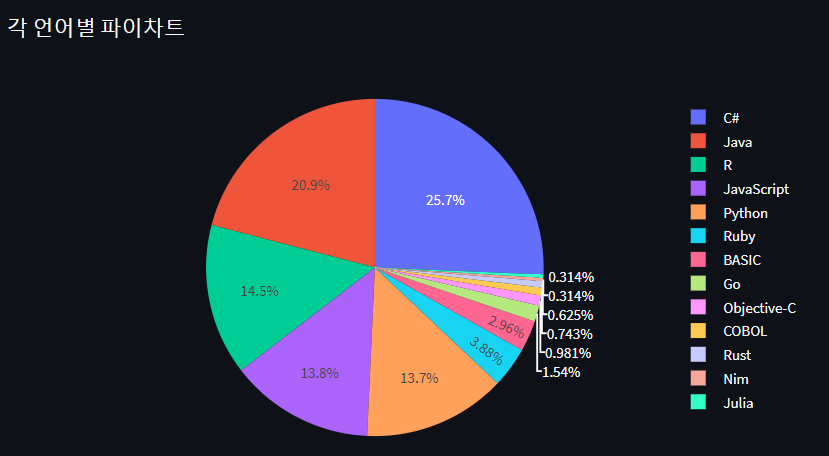
plotly bar chart
df4_sorted = df4.sort_values('Sum', ascending=False)

fig2 = px.bar(df4_sorted, x= 'lang', y='Sum')
st.plotly_chart(fig2)
반응형
'Library > Streamlit' 카테고리의 다른 글
| streamlit - streamlit을 EC2 server에서 실행 할 때, 터미널 접속을 끊어도 24시간 365일 돌아가도록 하는 방법 (0) | 2022.06.10 |
|---|---|
| Streamlit - Google Colab에서 학습한 인공지능을 사용하는 방법 (0) | 2022.05.22 |
| Streamlit - Chart (0) | 2022.05.19 |
| Streamlit - Python 개발시 파일을 분리하여 개발하는 방법 (0) | 2022.05.19 |
| Streamlit - sidebar를 만들고 file_uploader() 함수 이용하기 (0) | 2022.05.19 |


